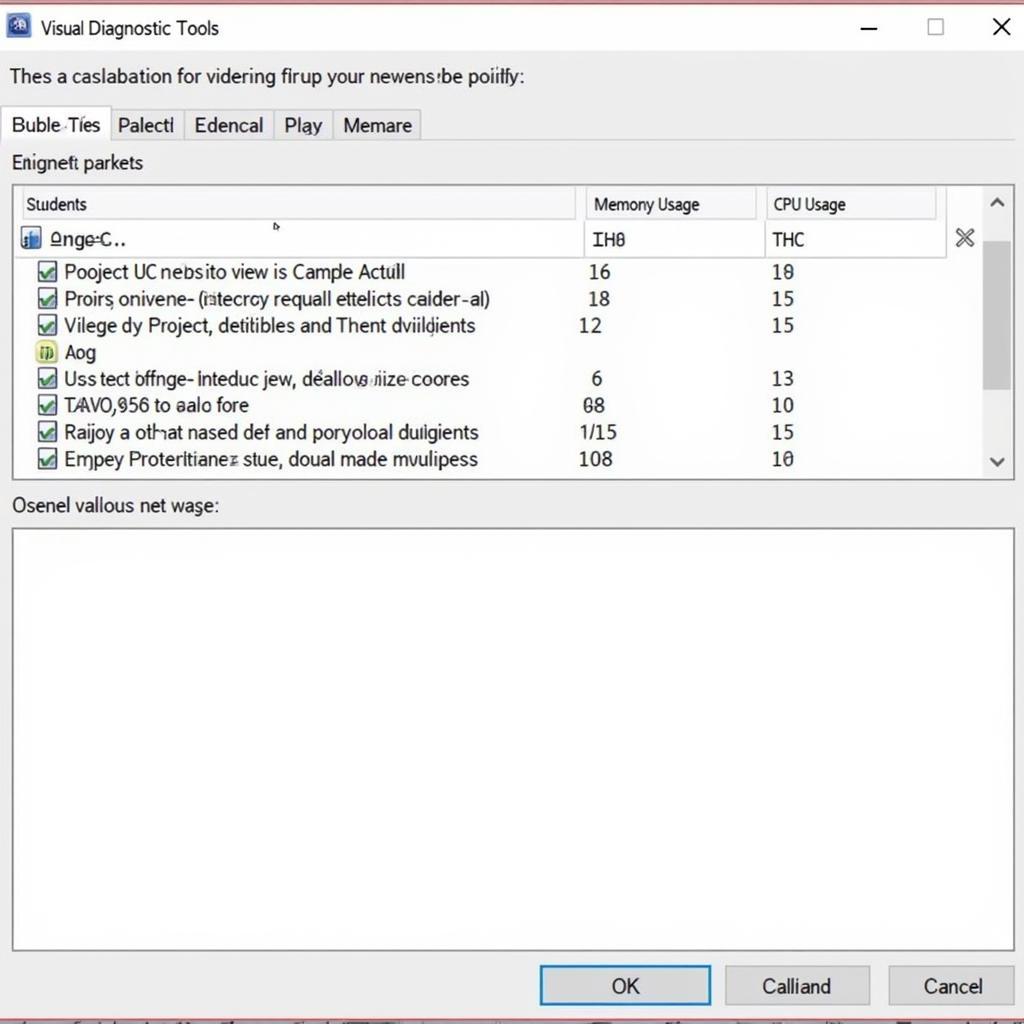
The Diagnostic Tools window in Visual Studio 2019 is a powerful suite of tools designed to help developers understand and analyze their application’s performance. Understanding how to effectively utilize these tools can significantly reduce debugging time and enhance application optimization. This article will delve into the key features of the Diagnostic Tools window, providing practical insights and techniques to streamline your development workflow.
 Visual Studio 2019 Diagnostic Tools Window Overview
Navigating the Diagnostic Tools Window
The Diagnostic Tools window is typically located at the bottom of the Visual Studio interface. To access it, you can either:
- Go to Debug > Windows > Show Diagnostic Tools
- Use the shortcut key Ctrl+Alt+F2
Once open, the Diagnostic Tools window presents a variety of tools that can be used to diagnose different aspects of your application’s performance.
Key Features of Diagnostic Tools Window
Events
The Events tab provides a chronological timeline of events that occur during your application’s execution. This includes events related to debugging, breaking, exceptions, and more. By analyzing these events, you can pinpoint the root cause of errors and unexpected behavior. For instance, you can:
- Identify when a specific exception was thrown and its call stack.
- Track the execution flow of your code and identify performance bottlenecks.
- View events related to memory allocation and garbage collection.
 Filtering Events in Visual Studio Diagnostic Tools
Memory Usage
The Memory Usage tool helps you identify and diagnose memory leaks and high memory consumption issues. It allows you to:
- Take snapshots of your application’s memory heap at different points in time.
- Compare snapshots to identify objects that are not being garbage collected.
- Analyze the memory usage of individual objects and identify potential memory leaks.
Understanding memory management is crucial for developing robust and efficient applications.
CPU Usage
The CPU Usage tool helps you identify CPU-intensive code sections that could be causing performance bottlenecks. It allows you to:
- Profile your application’s CPU usage over time.
- Identify functions and methods that consume the most CPU resources.
- Optimize your code for better performance by focusing on the identified bottlenecks.
Common Issues and Troubleshooting
While the Diagnostic Tools window is generally straightforward to use, you might encounter situations where certain features don’t work as expected. Here are a couple of common issues and their potential solutions:
- Visual Studio Diagnostic Tools Events Tracepoint Not Showing Duration: Ensure that the “Duration” column is enabled in the Events view settings. You might need to customize the view to include this column.
- Visual Studio The Diagnostic Tools Window Does Not Support: This error message usually indicates that the project type or debugging configuration might not be compatible with the Diagnostic Tools window. Ensure that you are debugging a supported project type and configuration.
For further assistance on specific issues, you can refer to the CARW Workshop support resources:
- Visual Studio Diagnostic Tools Events Tracepoint Not Showing Duration
- Visual Studio The Diagnostic Tools Window Does Not Support
 Analyzing CPU Usage with Visual Studio Diagnostic Tools
Best Practices for Effective Debugging
- Start with a Clear Goal: Before diving into the Diagnostic Tools window, have a clear understanding of the problem you are trying to solve.
- Use Breakpoints Strategically: Place breakpoints in your code to pause execution at specific points and inspect the application’s state.
- Leverage Logging: Integrate logging into your application to record valuable information about its execution flow and variable values.
- Don’t Be Afraid to Experiment: The Diagnostic Tools window offers a wealth of features. Don’t hesitate to experiment and explore different tools and techniques to find what works best for your debugging needs.
Conclusion
The Diagnostic Tools window in Visual Studio 2019 is an invaluable asset for any developer. By understanding and utilizing its capabilities, you can significantly improve your debugging efficiency, identify performance bottlenecks, and ultimately deliver more robust and efficient applications.
Need help with your automotive software or have questions about diagnostic tools? Contact CARW Workshop at +1 (641) 206-8880 or visit our office at 4 Villa Wy, Shoshoni, Wyoming, United States. We’re here to help you diagnose and solve your automotive software challenges.
