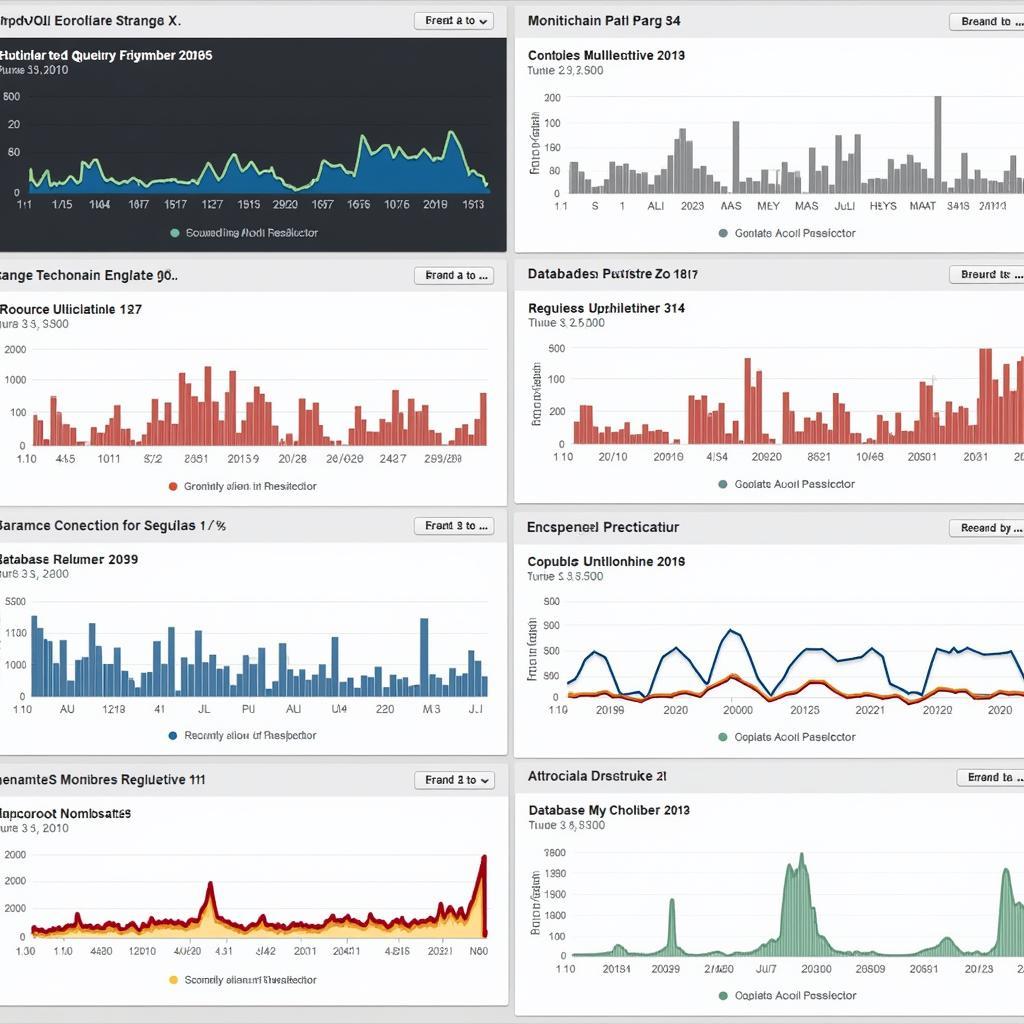
Postgresql Diagnostic Tools are essential for database administrators and developers to identify, troubleshoot, and resolve performance bottlenecks and other issues. These tools provide valuable insights into the inner workings of your PostgreSQL database, allowing you to optimize queries, monitor system health, and ensure smooth operation.
Unlocking PostgreSQL Performance with Diagnostic Tools
Understanding the performance characteristics of your PostgreSQL database is crucial for maintaining optimal efficiency. Diagnostic tools provide the means to monitor key metrics and identify areas for improvement.
Key PostgreSQL Diagnostic Tools
PostgreSQL offers a comprehensive suite of built-in diagnostic tools. Let’s explore some of the most valuable ones:
- PostgreSQL Logs: The database server log is your first line of defense when diagnosing issues. It records events, errors, and configuration changes, providing a chronological history of database activity.
- pg_stat_statements: This extension tracks execution statistics for all SQL statements run by the database. By analyzing this data, you can identify slow-running queries that might be impacting performance.
- pgAdmin: A popular open-source graphical interface for PostgreSQL, pgAdmin provides intuitive tools for browsing database objects, running queries, and monitoring server status.
- Auto Explain: This powerful feature automatically logs the execution plans of slow queries. Analyzing these plans helps identify bottlenecks and optimize query performance.
 PostgreSQL Monitoring Tools in Action
Interpreting Diagnostic Output
Once you’ve gathered data using these tools, the next step is interpretation:
- Analyzing PostgreSQL Logs: Look for error messages, long-running transactions, and patterns that might indicate underlying problems. Tools like pgFouine can help you parse and analyze log files effectively.
- Identifying Slow Queries with pg_stat_statements: Focus on queries with high execution counts, long execution times, or a large number of rows returned.
- Visualizing Data with pgAdmin: Leverage pgAdmin’s graphical dashboards and reports to visualize performance metrics, identify trends, and gain a holistic view of your database health.
Optimizing Queries for Peak Performance
Diagnostic tools not only help identify issues but also guide optimization:
- Using EXPLAIN Plans: Analyze the output of
EXPLAINandEXPLAIN ANALYZEto understand how PostgreSQL executes your queries. Identify areas where indexes are missing, joins are inefficient, or query logic can be improved. - Tuning Configuration Parameters: PostgreSQL offers numerous configuration parameters that can impact performance. Use diagnostic tools to monitor the effectiveness of your settings and fine-tune them based on your workload.
Common PostgreSQL Issues and Solutions
Let’s delve into some frequent PostgreSQL challenges and how diagnostic tools aid in their resolution:
- High CPU Utilization: Identify the source using tools like
toporhtop. pg_stat_statements can pinpoint CPU-intensive queries, while system logs might reveal external factors. - Slow Query Performance: Utilize
EXPLAINplans to analyze query execution and pg_stat_statements to identify slow-running queries. Consider adding indexes, optimizing joins, or rewriting queries. - Database Deadlocks: PostgreSQL logs record deadlock events. Analyze these logs to understand the resources involved and modify your application code to prevent future deadlocks.
 Troubleshooting PostgreSQL Errors with Diagnostic Tools
“Diagnostic tools are invaluable for maintaining a healthy and performant PostgreSQL database. By proactively monitoring your system, you can identify and address issues before they impact your users.” – [Expert Name], Senior Database Administrator at [Company Name]
Best Practices for Using PostgreSQL Diagnostic Tools
- Establish a Baseline: Gather performance metrics during normal operation to create a baseline for comparison when troubleshooting issues.
- Set Realistic Expectations: Understand that every query cannot be lightning fast. Focus on optimizing the most critical queries for your application.
- Automate Monitoring: Implement automated monitoring and alerting systems to notify you of potential issues proactively.
Conclusion
Mastering PostgreSQL diagnostic tools is essential for anyone responsible for managing and optimizing PostgreSQL databases. By understanding how to use these tools effectively, you can ensure peak performance, troubleshoot problems quickly, and maintain a healthy and efficient database environment. If you are looking for expert help with your PostgreSQL implementation, contact CARW Workshop at +1 (641) 206-8880 or visit our office at 4 Villa Wy, Shoshoni, Wyoming, United States. We are here to help you unlock the full potential of PostgreSQL.


One Response