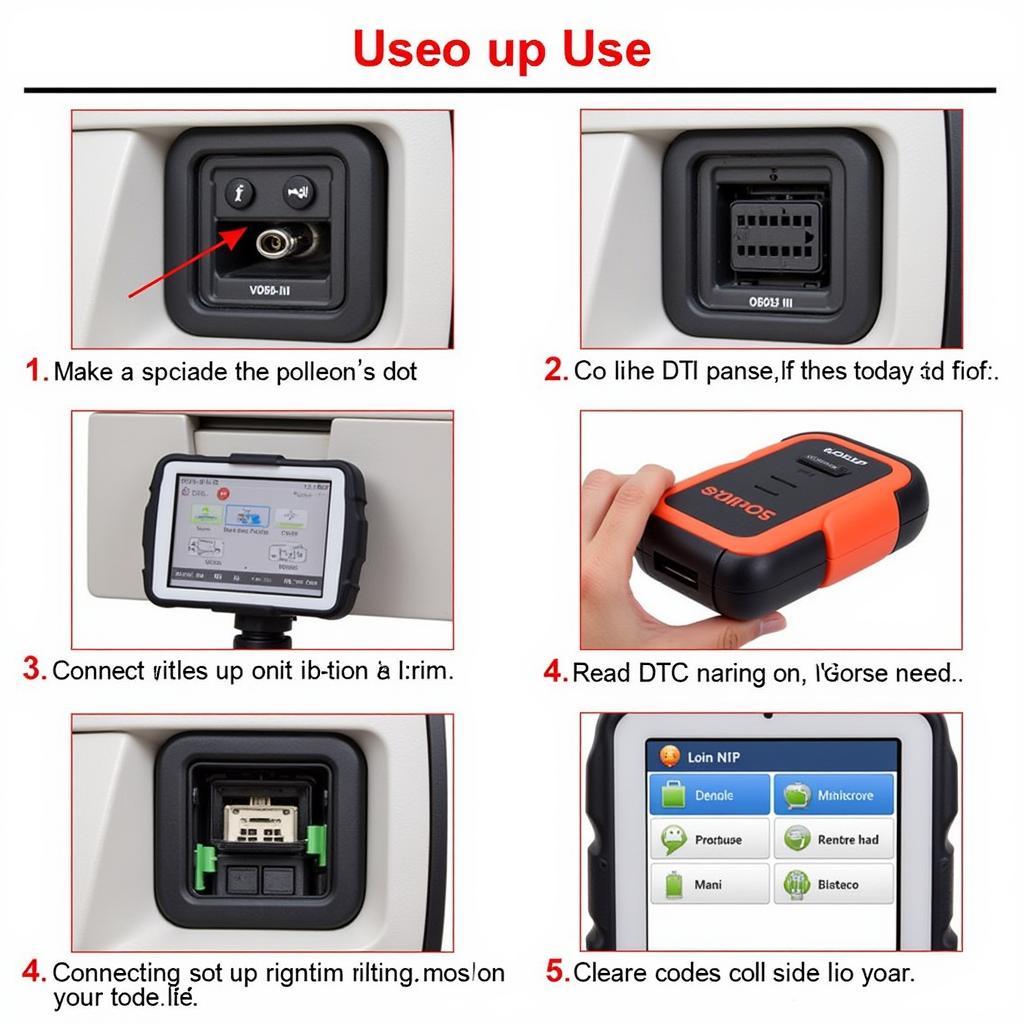
Windows Server 2012, despite no longer being officially supported by Microsoft, remains a crucial operating system for many businesses worldwide. Ensuring smooth operation and swift troubleshooting is essential for those still reliant on this platform. Thankfully, Windows Server 2012 boasts a powerful suite of diagnostic tools to help identify and resolve issues. This comprehensive guide will walk you through the key tools, their functions, and how to use them effectively.
Navigating the World of Windows Server 2012 Diagnostic Tools
Imagine your server as a well-oiled machine – even the slightest hiccup can bring down productivity. That’s where diagnostic tools step in, providing the insights needed to pinpoint the source of problems and apply the right fixes. Whether you’re experiencing slow performance, application crashes, or network connectivity issues, the right diagnostic tool can be your secret weapon.
Essential Windows Server 2012 Diagnostic Tools
Windows Server 2012 offers a range of diagnostic tools, each tailored to specific areas of your system. Let’s explore some of the most essential ones:
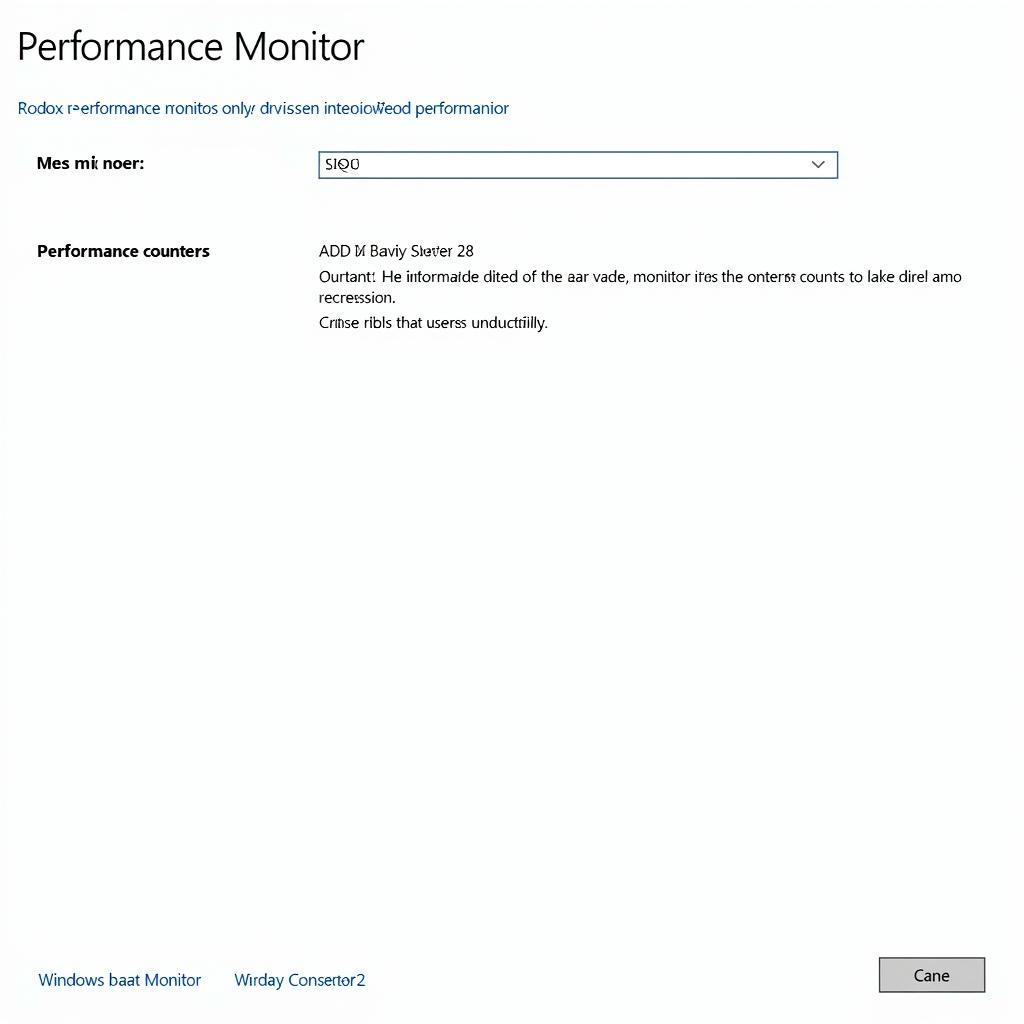
1. Performance Monitor
This powerhouse tool lets you monitor system performance in real-time or by analyzing log data. From CPU usage to disk activity and network traffic, Performance Monitor provides a comprehensive overview of your server’s health.
How to use it:
- Open Performance Monitor from the Administrative Tools menu.
- Use the Add Counters feature to select the performance metrics you want to track.
- Analyze the data displayed in graphs or reports to identify bottlenecks and performance issues.
 Performance Monitor in Windows Server 2012
2. Resource Monitor
Need a closer look at how your server resources are being utilized? Resource Monitor provides a detailed breakdown of CPU, memory, disk, and network usage by individual processes. This granular view helps identify resource-hogging applications impacting overall performance.
How to use it:
- Launch Resource Monitor by searching for it in the Start menu.
- Explore the different tabs (CPU, Memory, Disk, Network) to analyze resource consumption.
- Right-click on processes to access options like ending the process, analyzing its resource usage history, or viewing related modules.
3. Event Viewer
Think of Event Viewer as your server’s logbook. It records a vast array of events, from successful application launches to critical system errors. Analyzing these logs can provide crucial clues about the root cause of problems.
How to use it:
- Access Event Viewer through the Administrative Tools menu.
- Navigate through the various event logs (Application, System, Security, etc.) to find events related to the issue you’re troubleshooting.
- Double-click on an event to view its details, including event ID, source, date and time, and description.
 Using Event Viewer for Troubleshooting in Windows Server 2012
4. Windows Server 2012 Memory Diagnostic Tool
Suspect faulty RAM is causing system instability? The Windows Memory Diagnostic Tool tests your server’s memory for errors. This crucial tool helps identify RAM issues that can lead to data corruption, system crashes, and overall performance degradation.
How to use it:
- Run the Windows Memory Diagnostic Tool from the Start menu (search for “mdsched”).
- Choose to restart your server immediately or run the test the next time it starts.
- The tool will run various tests on your RAM and display the results after completion.
5. Network Diagnostics Tools
Windows Server 2012 offers a suite of network diagnostics tools:
- Ipconfig: Displays network configuration details like IP address, subnet mask, and default gateway.
- Ping: Tests network connectivity to a specific IP address or hostname.
- Tracert: Traces the route packets take to reach a destination, helping pinpoint network bottlenecks.
- Netstat: Displays active network connections, listening ports, and network statistics.
These tools are invaluable for troubleshooting network connectivity issues, identifying DNS problems, and analyzing network traffic.
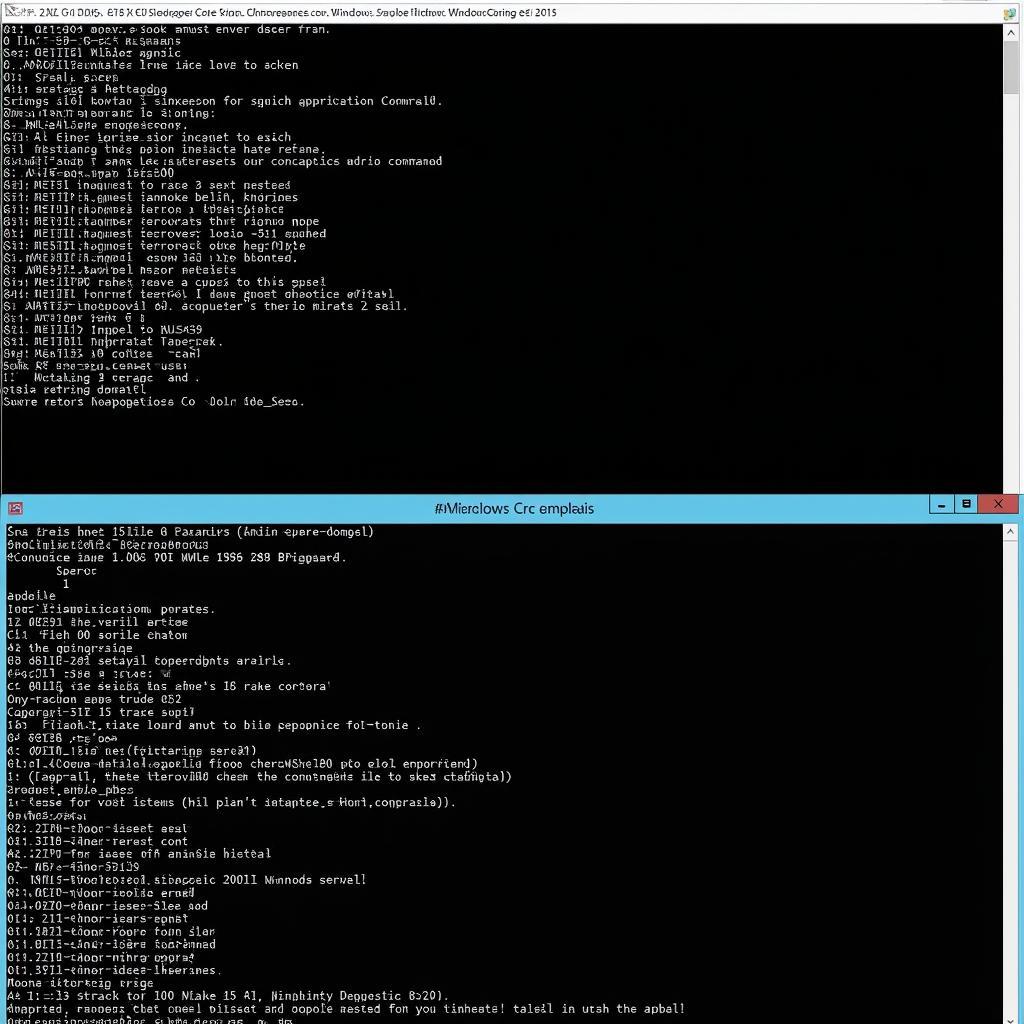 Network Diagnostics in Windows Server 2012: A Guide
Optimizing Your Server’s Performance
Beyond troubleshooting, Windows Server 2012 Diagnostic Tools can also be used proactively to optimize your server’s performance. By regularly monitoring performance metrics, analyzing resource utilization, and reviewing event logs, you can:
- Identify and address potential bottlenecks before they impact users.
- Optimize system settings and resource allocation for specific workloads.
- Detect and mitigate security risks by monitoring for suspicious activity.
Expert Insights
“Regularly using diagnostic tools is not just about fixing problems; it’s about understanding your server’s behavior, anticipating issues, and ensuring optimal performance for your business,” says John Smith, a Senior System Administrator with over 10 years of experience managing Windows Server environments.
Need Help with Your Windows Server 2012?
Troubleshooting complex server issues can be challenging. If you’re struggling to resolve problems or simply need expert assistance, don’t hesitate to reach out to CARW Workshop. Our team of certified technicians is here to provide reliable and efficient IT solutions tailored to your specific needs.
Contact us today at +1 (641) 206-8880 or visit our office at 4 Villa Wy, Shoshoni, Wyoming, United States. We’re here to help keep your business running smoothly.
Frequently Asked Questions
1. What is the Windows diagnostic tool memory?
The Windows Memory Diagnostic Tool, also known as mdsched.exe, is a built-in utility in Windows Server 2012 that checks your computer’s RAM for errors.
2. Why are Windows Server 2012 diagnostic tools important?
They are crucial for identifying and resolving server issues, optimizing performance, and ensuring the smooth operation of your IT infrastructure.
3. Can I use these tools even if my server seems to be working fine?
Absolutely! Regular use of diagnostic tools can help identify potential problems before they escalate, allowing you to proactively maintain server health.
4. What is windows memory diagnostics tool?
It is a built-in tool for checking the health of your computer’s RAM by writing and reading data to and from the memory.
5. What should I do if I find errors using these tools?
If you encounter errors, it’s best to consult with an experienced IT professional or contact Microsoft support for guidance on appropriate solutions.

