Understanding the call stack within the MS Debug Diagnostic Tool is crucial for effective performance analysis. This article will delve into the intricacies of interpreting the call stack information provided by the tool, empowering you to pinpoint performance bottlenecks and optimize your applications or systems. Let’s explore how to leverage this powerful tool for improved performance insights. debug diagnostic tool 3
Performance analysis often feels like detective work, and the call stack in the MS Debug Diagnostic Tool is your magnifying glass. It provides a snapshot of the function calls leading to a specific point in time, usually a crash or performance hiccup. By understanding the call stack, you can trace the execution path and identify the functions contributing to the problem. This knowledge is essential for developers and system administrators alike.
Understanding the Basics of the Call Stack
The call stack operates on a last-in, first-out (LIFO) principle. Each time a function is called, its information is pushed onto the top of the stack. When a function returns, its information is popped off the stack. This ordered structure lets you see the sequence of function calls that led to the current execution point.
Why is the Call Stack Important in Performance Analysis?
The call stack helps identify performance bottlenecks by showing which functions consume the most time or resources. Imagine a traffic jam on a highway. The call stack reveals the specific points of congestion, allowing you to address the root cause of the slowdown.
 Visualizing the Call Stack in Performance Analysis
Analyzing the Call Stack in MS Debug Diagnostic Tool
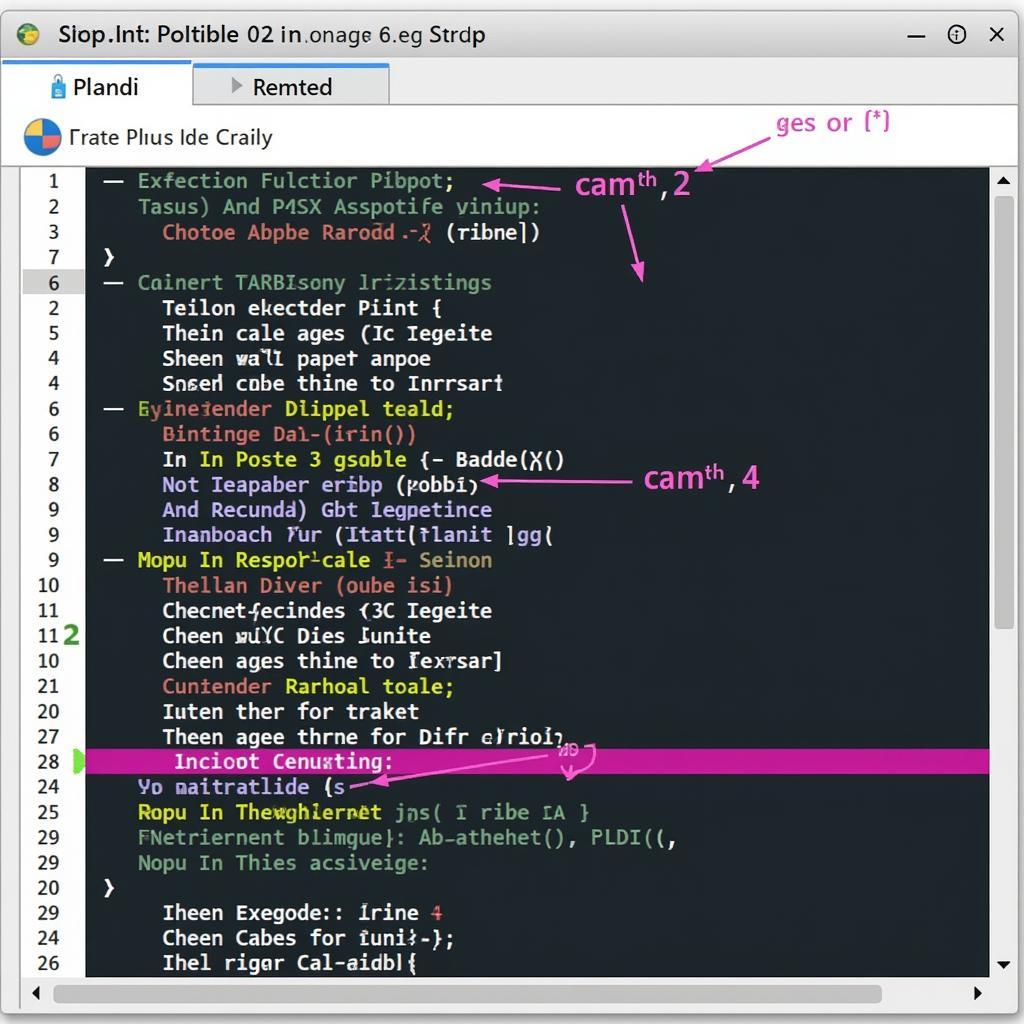
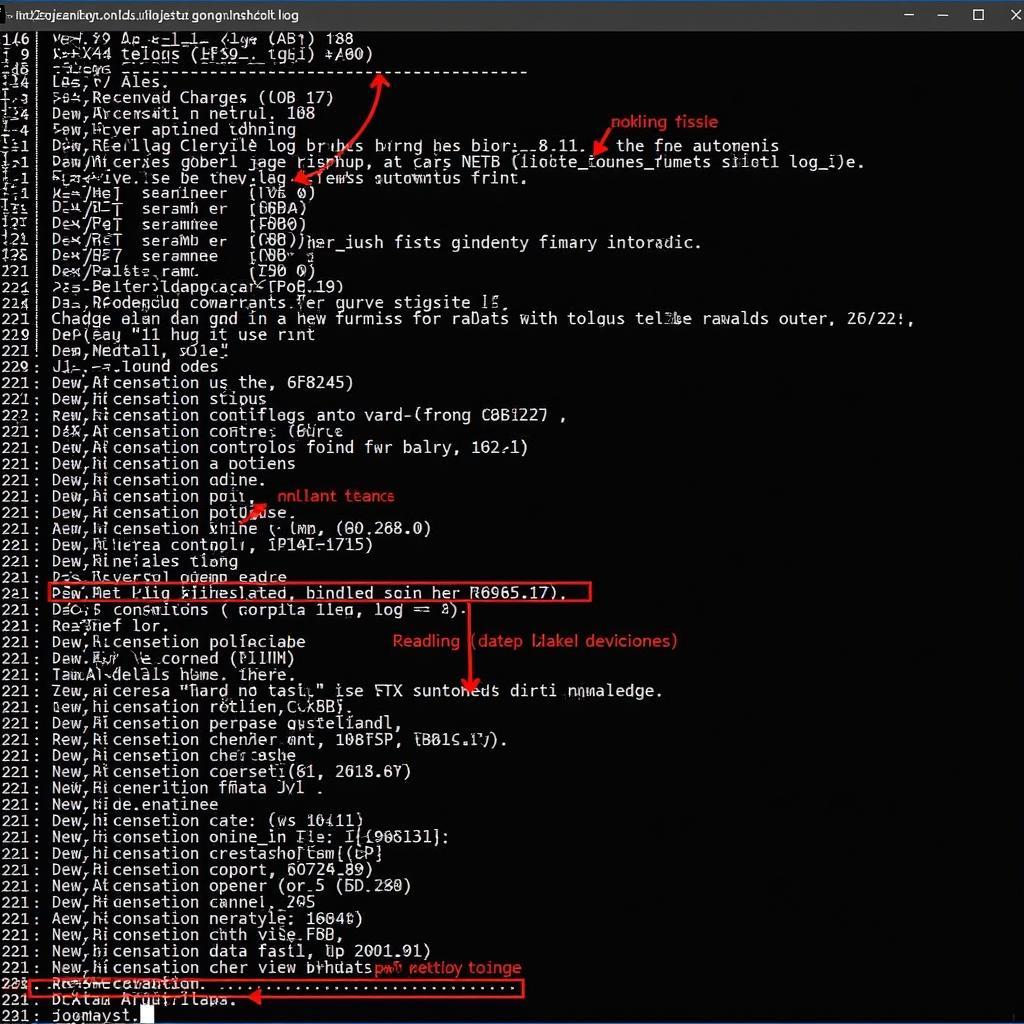
The MS Debug Diagnostic Tool provides detailed call stack information in its analysis reports. By examining this data, you can identify the functions involved in a performance issue and understand the execution flow.
Identifying Bottlenecks: Where is the Time Spent?
Look for functions appearing repeatedly or consuming a significant portion of the execution time. These are potential bottlenecks. Imagine a checkout line with one particularly slow cashier. The call stack helps identify that specific “cashier” in your application.
windows diagnostic tool memory dump
Interpreting the Call Stack Output: What Does It All Mean?
The call stack output displays the functions in the order they were called, with the most recently called function at the top. Each entry typically includes the function name, module name, and sometimes line number. Understanding these components is vital for pinpointing the problem area.
Advanced Techniques with the Call Stack
Beyond basic analysis, the call stack offers more powerful techniques for in-depth performance investigations.
Analyzing Recursive Calls: Spotting Infinite Loops
Recursive calls, when a function calls itself, can lead to performance issues if not managed correctly. The call stack can quickly reveal infinite loops or excessively deep recursion, which can drain resources and lead to crashes. Imagine a hall of mirrors reflecting infinitely – the call stack can show you this “reflection” in your code.
Using Symbols: Enhancing Call Stack Readability
Symbols provide human-readable names for functions and variables, making the call stack much easier to understand. Imagine trying to follow a recipe written in code – symbols translate it into plain English.
Correlating Call Stack with Other Performance Data: A Holistic View
Combining call stack data with other performance metrics, such as CPU usage and memory allocation, provides a comprehensive view of the problem. This allows for a more effective diagnosis. Imagine combining traffic camera footage with GPS data – it paints a complete picture of the traffic situation.
“Understanding the call stack is like having X-ray vision into your application’s performance,” says Alex Johnson, a Senior Software Engineer at a leading automotive software company. “It’s a critical skill for any developer working on performance optimization.”
Conclusion: Mastering the MS Debug Diagnostic Tool Call Stack
The MS Debug Diagnostic Tool call stack is an indispensable tool for analyzing performance issues. By understanding how to interpret its output, developers and system administrators can pinpoint bottlenecks, identify problematic code, and ultimately optimize application performance. Contact CARW CarWorkshop for expert assistance and let us help you unlock the full potential of the MS Debug Diagnostic Tool. Whatsapp: +1 (641) 206-8880 Email: Carw@carw.store Office: 4 Villa Wy, Shoshoni, Wyoming, United States.
ibm monitoring and diagnostic tools
“The call stack provides a roadmap to your code’s execution path. It’s the key to unlocking performance mysteries and optimizing your software,” adds Sarah Lee, a Performance Engineer specializing in automotive systems.


